
Your Business and Industry
The Q3 2023 BTL Barometer
In our Q3 BTL barometer, brought to you in conjunction with the latest BVA BDRC Landlord Panel research, we evaluate the trends which are impacting your landlord clients and how their portfolios are currently shaping up.

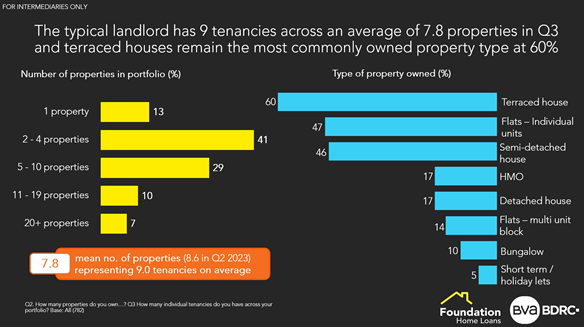
Following an upturn in Q2, the average portfolio size has softened this quarter with the typical landlord now having 9 tenancies across an average of 7.8 properties. On a regional basis, landlords in the West Midlands and Wales are reporting the largest portfolio sizes 10.7 and 10.1 properties respectively.
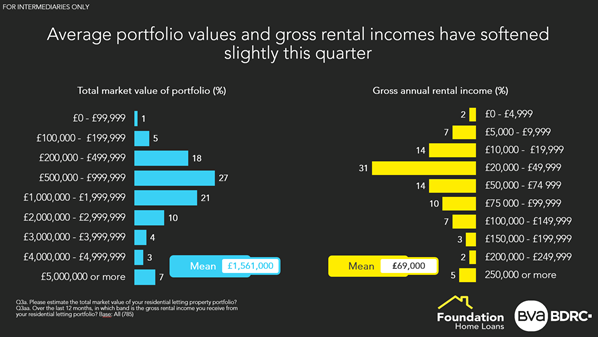
In terms of performance, average portfolio values and gross rental incomes have also softened slightly this quarter. The typical portfolio has decreased to £1.56m, a fall of circa £90k vs. Q3 figures and gross rental income is down to £69k (+£2k vs. Q2).
The typical portfolio continues to be mostly divided by outright ownership and BTL mortgage borrowing. Although, owning with a mortgage has slightly decreased this quarter by 0.6 properties when compared to Q2 figures. Fractional and commercially funded property continue to be less common forms of property ownership.
Not registered with us yet? Register with us today!
Focusing on property type within these portfolios, terraced houses remain the most commonly owned at 60%. Landlords with 4+ properties are significantly more likely to own terraced houses (68%) than landlords with 1-4 properties (49%). Individual flats and semi-detached houses continue to follow closely behind at 47% and 46% respectively.
Landlords letting in the North (NE, NW and Yorks & Humber) continue to lead on terraced house ownership, with London landlords still having the highest proportion of flats.
The structure of portfolio funding remains mostly consistent for another quarter. The average number of BTL loans held also remains stable since last quarter (down by just 0.1 vs. Q2).
On average, 61% of the properties in a leveraged landlord’s portfolio are owned on a BTL mortgage. Following an increase in Q2 23, the average portfolio size for a leveraged landlord has fallen back, although – at 9.3 properties - this still sits a higher level than averages generated over the past two years.
Have a look at our BTL mortgages
On average, leveraged landlords owe approx. £804k on their BTL borrowing. This rises to £1.3M for landlords with more than 4+ properties, however, almost 40% of landlords have no BTL exposure.
This data represents a strong reflection of how portfolios are stacking up in the current economic climate and we hope it can be of some use to you and your landlord clients.
FOR INTERMEDIARIES ONLY


