Your Business and Industry
The BTL by Foundation Q3 BTL Barometer
In our Q3 2024 BTL barometer, brought to you in conjunction with the Pegasus Insight Landlord Trends research report, we evaluate the trends which are impacting your landlord clients and how their portfolios are currently shaping up.
The latest data shows that around half of NRLA members have been operating as a landlord for over 20 years. This is reflected in the demography of the NRLA member base, with an average age of 62 and 4 in 10 being retirees. Typically, landlords who have been active for longer tend to have larger, more diverse portfolios which achieve a higher yield compared to those newer to the PRS. Longer standing landlords are also significantly more likely to have sold at least one property in the last year and have intentions to sell in the next year.
Breaking down the ‘typical’ Q3 portfolio, this was estimated to be worth £1.5m, generating a gross annual income of £78k. With a typical portfolio size of 8.0 properties in Q3, this equates to the average property being worth £194k, generating £813 a month in rental income.
The research shows that of those 8 properties, just over half are owned outright. For circa 50% of properties utilising BTL borrowing, the vast majority are owned using an interest only mortgage with commercial loans and repayment mortgages much less common. Outright ownership is suggested to be more likely amongst those with the smallest portfolios (61% of those with 1–3 properties), although 1 in 3 of the very largest 20+ property landlords own their entire portfolio without borrowing.
Following a dip at the end of 2023, the average portfolio size has shown consistent growth in 2024. Regionally, landlords with property in the West Midlands and North East have the largest average portfolio sizes in Q3, at around 12 properties. In contrast, landlords operating in Outer London and the South East typically have the smallest portfolios, at just over 7 properties on average.
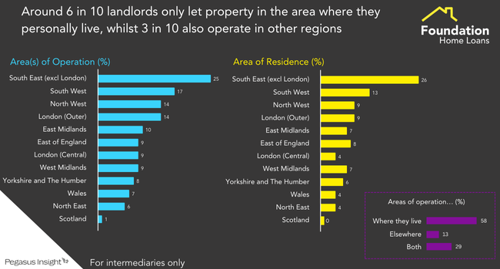
Around 6 in 10 landlords only let property in the area where they personally live, while 3 in 10 also operate in other regions. Just 13% exclusively let property in regions outside the area where they personally live. It remains the case that London and the South dominates in terms of landlord activity with 56% of landlords operating in these areas, this is more than have property in the North and Midlands combined (48%).
Unsurprisingly, larger landlords tend to have more diverse portfolios in terms of the tenant groups they house, although there is only a significant uplift in the prevalence of students once a landlord has a portfolio of at least 20 properties.
Focusing on property types, landlords tend to have a range of property types in their portfolio, with terraced houses most common. The type of properties owned varies significant by region, reflecting the profile of local housing stock; terraced houses dominate in the North and Midlands while flats are more prevalent in London and the South East. 20% have HMOs within their portfolio (3.1 on average), with portfolio landlords (4+ BTL mortgages) twice as likely as their unleveraged counterparts to have an HMO (29% vs. 15%).
This data represents a strong reflection of how portfolios are stacking up in the current economic climate and we hope it can be of some use to you and your landlord clients.
For intermediaries only