Your Business and Industry
The Q2 2023 BTL Barometer
In our Q2 BTL barometer, brought to you in conjunction with the latest BVA BDRC Landlord Panel research, we evaluate the trends which are impacting your landlord clients and how their portfolios are currently shaping up.

After a relatively stable 12 months, the average portfolio size has taken a sharp upturn in Q2 to reach its highest point since Q1 2019.
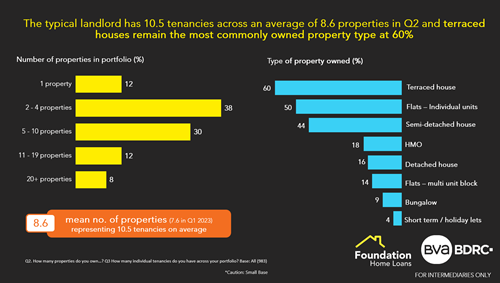
Breaking this down, the typical landlord is said to have 10.5 tenancies across an average of 8.6 properties in Q2. This represents a 2.1 property increase in the average portfolio size and is likely to be a result of an increasing number of single property landlords exiting the market.
On a regional basis, landlords in the North East and East of England own the largest portfolios with an average of more than 20 properties each.
Take a look at our BTL mortgages
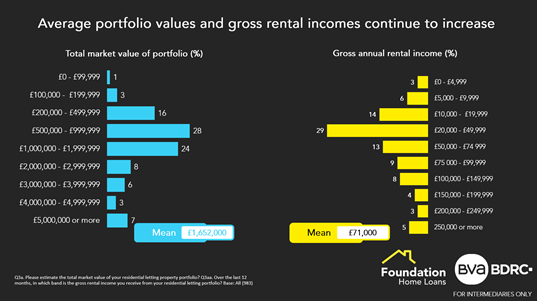
In terms of performance, average portfolio values and gross rental incomes continue to increase. The typical portfolio is reported to have increased to £1.65m (+ approx. £100k vs. Q1 2023) and gross rental incomes have nudged up to £71k (+£1k vs. Q1). At an average portfolio size of 9.7 properties, the typical rental property value is £170,309 (- approx.£33.7k vs. Q1) generating an annual income of £7,319 or £610 a month
Outright ownership and BTL mortgage borrowing continue to be the most common forms of property ownership. The typical portfolio is almost equally divided by those with mortgages (4.2 properties) and outright owners (4.5 properties). Fractional and commercially funded properties account for a much smaller proportion of rental properties and are almost unheard of amongst landlords with fewer than 6 properties.
Terraced houses remain the most commonly owned property type at 60%. Landlords with 11-19 properties report the highest incidence of terrace houses at 76%. Individual flats and semi-detached houses are also predominant property types at 50% and 44% respectively. Other property types are less common, although landlords with 20+ properties are much more likely to have these in their portfolio.
The typical landlord owes approximately £504k in BTL borrowing, but over a third of landlords (36%) have no BTL exposure at all. Looking at those who have a BTL mortgage, the total average amount borrowed rose to almost £800k, up by almost £50k vs. Q1.
Not registered with us yet? Register with us today!
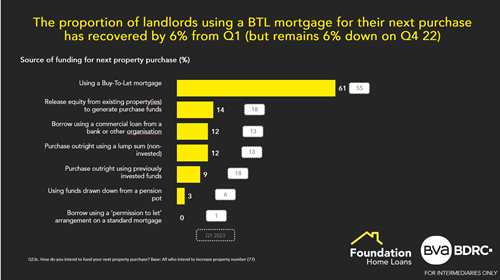
The proportion of landlords using a BTL mortgage for their next purchase has recovered by 6% from Q1 figures (but remains 6% down on Q4 22). The proportion of landlords sourcing funding from a commercial loan remains stable at 12%.
This data represents a strong reflection of how portfolios are stacking up in the current economic climate and we hope it can be of some use to you and your landlord clients.
For intermediaries only